
What Your Metrics Say About You: Lessons from the ATM User Dashboard
Task data goes beyond simply tracking completed work, it’s about uncovering patterns. This blog explores what legal teams are learning from the Advanced Task Management User Dashboard, from spotting bottlenecks to balancing workloads and boosting overall performance.

What Task Metrics Are Really Telling You
Legal teams are under constant pressure to deliver faster, cleaner results, without burning out. That’s why visibility into task performance isn’t a luxury—it’s a necessity.
Metrics don’t just show what’s happening. They show why it’s happening, and how to fix it.
1. Bottlenecks Tell a Bigger Story
When tasks pile up in one queue or when snoozed tasks begin to spike, in addition to being a productivity issue, it’s a red flag. The dashboard helps firms identify these patterns and ask key questions:
- Is a specific role overwhelmed?
- Are users snoozing to avoid unclear instructions of overcommitment?
- Is something in the workflow causing repeated slowdowns?
The insight? Bottlenecks aren’t always about headcount, they often reveal deeper workflow gaps.
2. Missed Deadlines Are a Symptom, Not The Problem
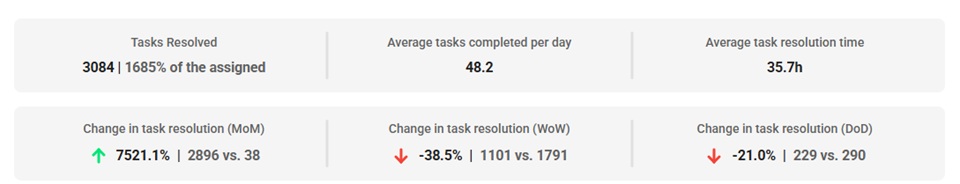
Performance issues often stem from inefficiencies that go unnoticed—until they become patterns. The Advanced Task Management User Dashboard brings those patterns to light with insights like total tasks resolved, average resolution time, and average tasks completed per day. These indicators give teams clear visibility into how work is progressing, where it slows down, and how overall productivity trends are shifting.
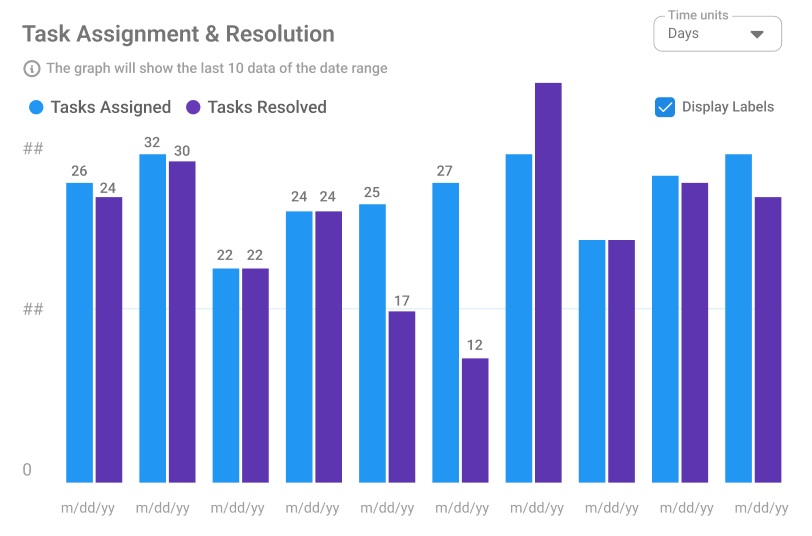
The task assignment resolution chart is particularly useful for identifying trends over time, specifically how many tasks are being assigned versus resolved each day. If assignments consistently outpace resolutions, it’s a clear sign of potential overload. This insight helps teams proactively reallocate work and optimize workflows before delays stack up.
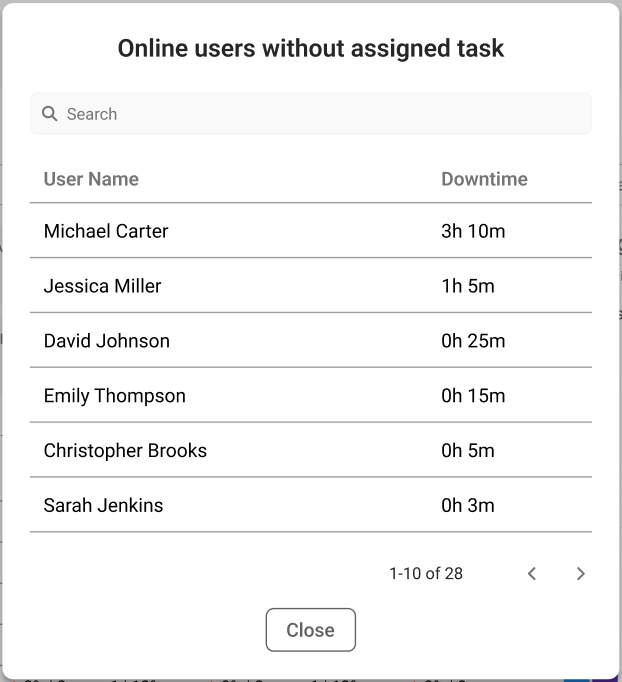
3. Workload Imbalance Isn’t Just Unfair, It’s Inefficient.
When work loads skew heavily to one side, everything slows down. One person drowns in tasks while another waits for their next assignment, and that imbalance impacts timelines, team morale, and client outcomes.
The User Dashboard makes it easy to sport and solve this. With a clear view of how tasks are distributed across roles, legal teams can rebalance in real time. And with shared queues, it’s no longer about guesswork, it’s about getting the right work to the right people.
Your Dashboard Is Talking. Are You Listening?
Data alone won’t change a firm. But data with intention? That’s how real transformation starts.
The Neodeluxe Advanced Task Management User Dashboard gives legal teams a powerful feedback loop, one they can use to iterate smarter, assign better, and deliver work faster.